
Amid record-breaking attendance at the recent National Association of Science Writers conference in Cambridge, dozens of journalists and other writers took time out for a panel session on one of the hottest topics in journalism today: Data.
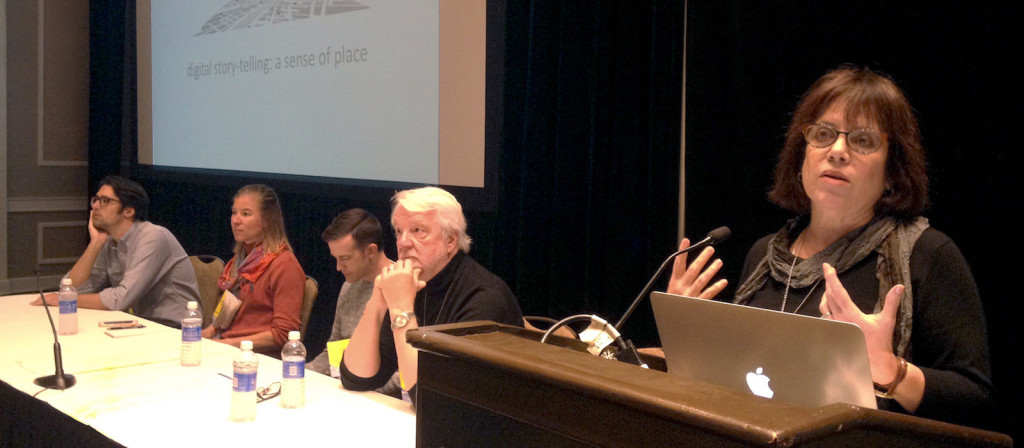
The assemblage of experts, seated right to left in the image above, included the Wall Street Journal‘s Lee Hotz; Tim De Chant of NOVA Next; and Christie Aschwanden and Ritchie King from web upstart FiveThirtyEight; along with moderator and MIT Knight Science Journalism Program director Deborah Blum (standing, far right). The group shared insights and strategies on how best to find and tell stories buried in what can often be intimidating and patternless reams of information.
Using New York City as an example, Hotz called data a potential “bridge to an invisible city, giving form to an invisible geography of the places we inhabit.”
By associating bits of collected information like survey responses, municipal complaints, or fast food delivery orders with geographic location information — a practice known as geotagging — Hotz described how collections of data can be used to illustrate hidden social patterns, with everything from pizza delivery routes, sexual fantasies, music preferences, and noise complaints from NYC residents coming to life on maps of Manhattan and the outer boroughs.
“As journalists, as story tellers, we’re wise to use all of the sensory data,” Hotz said. “It enriches … stories and conveys narratives.”
Along these lines, Hotz shared the backstory on the Journal’s popular collaboration with the Weill Cornell Medical College’s PathoMap Project, in which researchers swabbed DNA from 466 open subway stations in New York City. More than 15,000 different species of bacteria — over half of them virtually unknown to science — were collected.
Making sense of this data took the help of several computer programs. For Hotz, all journalists must expect to be data journalists — indeed, number crunchers — in one way or another. “I don’t think that these distinctions exist now in the same way as they did before,” he said. While the tools used to analyze data may change over time, Hotz added, what matters more, is that we become “familiar with the idea that data has a story to tell us.”
The Journal boiled down over one million lines of data to create an interactive map tracking bacteria across the New York City subway system.
De Chant and the team from FiveThirtyEight followed Hotz with explorations of their own use of data to tell stories, after which they took questions from the crowd. A common concern among journalists in attendance: How to reliably sort through and clean up the large and unwieldy datasets that journalists increasingly encounter.
“Never underestimate the power of your own eyeballs,” said De Chant. “Comb through the data and make sure that any different way you’re looking at it, it’s working.”
Added Aschwanden: “Every journalist should learn at least some basic statistics — it’s a really powerful antidote to bullshit.”
____
If you’re looking for tools to help you harness the power of digitized data, check out KSJ@MIT’s data journalism resource list.
Photograph by Margaux Phares


Leave a Reply